The latest Omaha housing data shows a market moving away from the pandemic extremes and settling into a more familiar rhythm. Inventory is up, closed sales slipped in November, median prices are essentially stable, and mortgage spreads have improved — a combination that points to price stabilization rather than dramatic collapse.
Below I break down the five most important factors you should watch: supply, new construction versus existing resale, affordability and regulatory costs, actual home price movement, and interest rates and buyer demand. Each factor matters for different reasons, so reading them together gives the clearest picture of where the Omaha market stands.
Table of Contents
- Intro: Omaha housing inventory and why it matters
- New construction versus existing homes in Omaha
- Affordability, regulation, and why smaller homes are uncommon
- Omaha Home prices in context
- Interest rates, spreads, and buyer demand
- Closed sales and seasonality
- Days on market and seller advice
- Other indicators: foreclosures, lumber, and jobs
- What this means for Omaha buyers and sellers
- Key takeaways from the latest Omaha housing data
- Frequently asked questions
- Final perspective
Intro: Omaha housing inventory and why it matters
One of the clearest signals in the Omaha housing data is inventory. Douglas and Sarpy counties currently list roughly 2,316 active homes. Compared to last year, overall inventory is up about 8.9%. That increase gives buyers more choices and helps stabilize prices.
Breaking that total down, the resale or existing market counts about 1,312 active listings, which is up roughly 16.9% year over year. New construction makes up the remainder, near 1,040 units and essentially flat compared to 2024.
Why does inventory matter? Because more inventory means sellers have to be realistic. Pricing becomes the primary tool to drive buyer attention. When we look across a 10-year trend, current inventory levels are beginning to resemble pre-pandemic norms — that is, the market is normalizing from the extreme low-inventory conditions we saw during the pandemic.
New construction versus existing homes in Omaha
The mix between new construction and existing homes is a defining feature of today's Omaha housing data. New build inventory has grown substantially since 2018. Back then there were roughly 764 new construction homes on the market. Today that number is close to 1,040 — nearly a 30 percent increase.
A major reason for the jump was the entry of a national builder into the metro market in late 2021, which pushed new supply higher in the years that followed. A strong new construction pipeline is healthy for a growing metro. It helps keep price pressure in check and provides buyers more choices, especially in growing suburbs.
But new construction behaves differently than resale. Builders adjust quickly to demand and costs. When market conditions soften, they slow production. When conditions improve, they ramp up. That responsiveness shows up in the Omaha housing data as swings in new build sales and in the median prices for new homes.
Affordability, regulation, and why smaller homes are uncommon
Affordability is a real concern. Buying is more expensive now than five years ago, but Omaha remains more affordable than many larger metros. Still, many people ask why builders do not simply build much smaller, lower-cost homes to solve the problem.
One of the clearest takeaways from local Omaha housing data is that a significant portion of new construction cost is structural: roughly 25 percent of the price of a new home can be traced to government-driven elements. These include zoning requirements, impact fees, environmental and engineering studies, permitting delays, utilities, building codes, inspections, storm water compliance, and various mandates tied to codes. These are not optional add-ons that can be trimmed without consequence — they are often required and can compound.
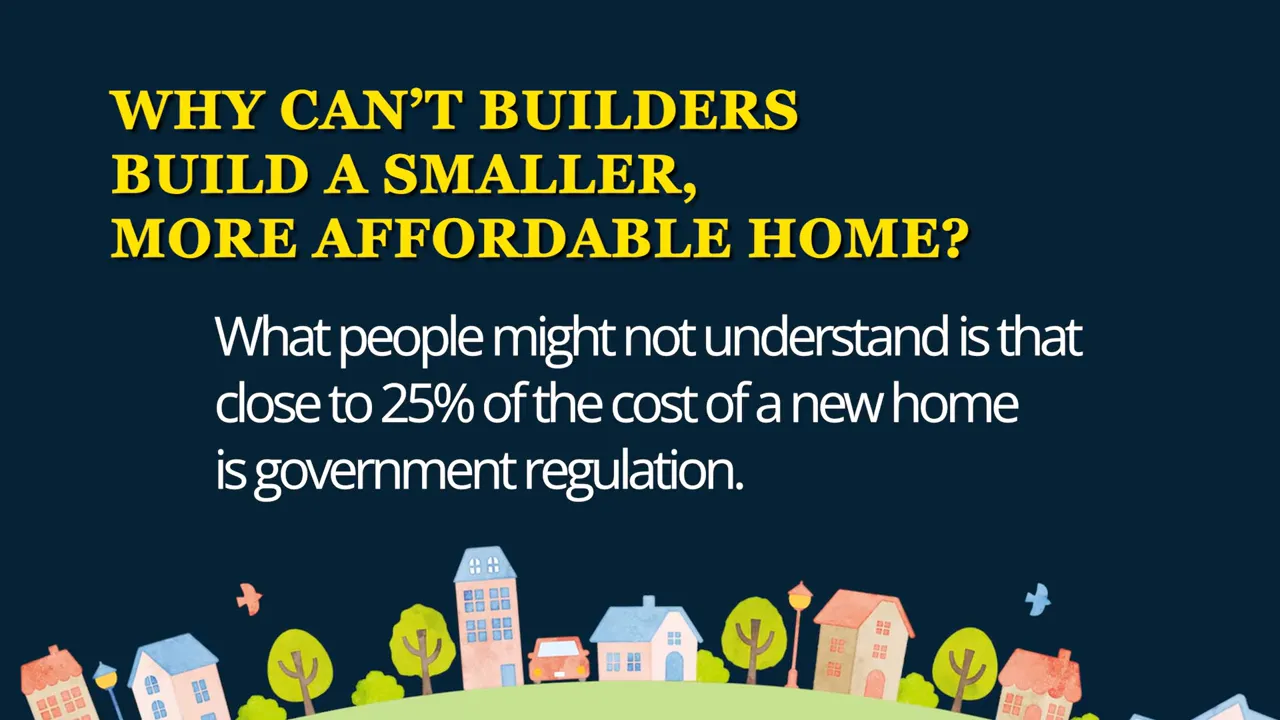
When you layer on complexity and delays, costs rise and competition falls. It is therefore misleading to call this a "builder greed" problem. Instead, we face a cost-floor problem: even a modest home hits a minimum cost because of regulation, fees, and compliance. That reality helps explain why the idea of a $250,000 new construction starter home is increasingly rare.
Omaha home prices in context
Looking at home price movement is where the Omaha housing data becomes most actionable for buyers and sellers. Median closed sales price across Douglas and Sarpy counties sits around $341,027, which is up roughly 0.9 percent year over year. That is stabilization — not runaway growth and not a crash.
Split the market and you see nuance. The median closed price for new construction is near $427,789, down about 4 percent from 2024. The median for existing homes is around $313,000, up about 4.3 percent.
It is useful to frame these numbers against national context. Nationwide, housing prices rarely fall dramatically over sustained periods. Going back to 1950, prices declined nationally in only a small number of years, with the worst single-year national decline around 12 percent during the financial crisis in 2008. Local markets can diverge from national patterns, but the national history shows long-term resilience.
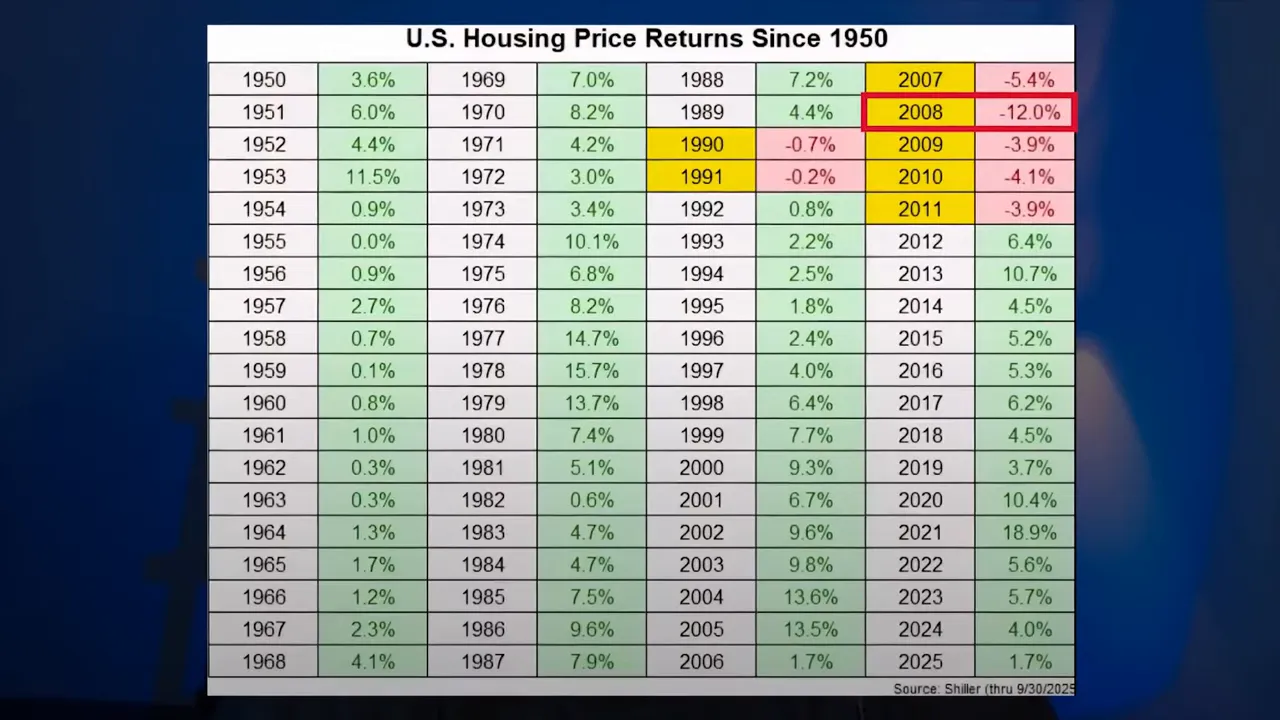
A practical example: a homeowner who purchased in 2006 at the market peak saw a substantial value drop over the following five years — a useful reminder that markets are cyclical. But by holding through the recovery that started around 2012, the homeowner saw values climb back over subsequent years. The lesson from this Omaha housing data is that short-term volatility happens; long-term ownership usually smooths those ups and downs.
Interest rates, spreads, and buyer demand
Mortgage rates are a primary driver of buyer affordability and demand. Current market data shows 30-year conventional rates near 6.32 percent. Rates have trended down from recent highs, but they are still a meaningful cost for buyers.
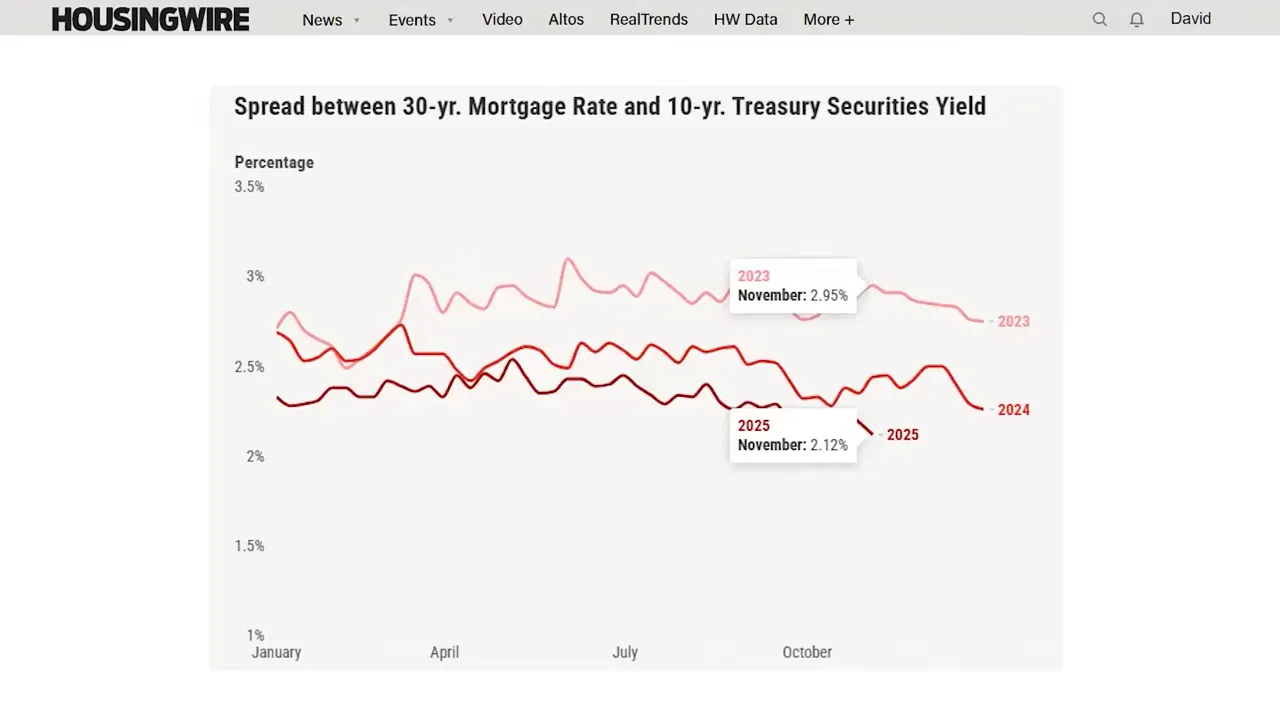
One positive technical indicator is the mortgage spread — the gap between Treasury yields and average mortgage rates. In volatile periods investors demand higher spreads, which pushes mortgage rates higher. The spread peaked near 2.91 percent in 2023 but has recently improved to around 2.12 percent. Lower spreads help drive down mortgage rates even if Treasury yields stay elevated.
When spreads narrow and mortgage rates soften, more buyers re-enter the market. According to national data, a one percentage point drop in rates could produce hundreds of thousands of additional home sales. For Omaha, improved spreads and modestly lower rates should raise buyer activity heading into spring, which means increased competition for inventory if new listings do not rise proportionally.
Closed sales and seasonality
Closed sales are the clearest measure of market pace. November recorded about 756 closed sales across Douglas and Sarpy counties, down roughly 10.8 percent from the previous year. Both new construction and resale sales declined — new builds dropped more steeply at approximately 23.7 percent, while existing home sales were down about 7.9 percent.
Seasonality matters. Sales typically peak in summer, taper off in fall, bottom out in winter, and pick back up in spring. The recent decline in closed sales is not necessarily alarming in isolation; it reflects seasonal patterns plus short-term economic uncertainty. Events like a government shutdown can dampen buyer confidence and delay closings, which shows up quickly in the Omaha housing data.
Days on market and seller advice
One metric every seller should watch in the Omaha housing data is days on market. Median days on market for existing homes currently sits near 10 days. That is longer than the blistering pace of pandemic-era sales and gives buyers somewhat more negotiation leverage.
For sellers that means pricing is critical. Ninety percent of effective marketing is price. If a home is not selling, marketing or staging alone will rarely solve the problem — price is the lever that most consistently produces activity. If you need to adjust price, make a meaningful adjustment to re-spark interest rather than tiny tweaks that fail to change buyer perception.
Other indicators: foreclosures, lumber, and jobs
Foreclosures have increased since the pandemic, but they remain far below the peaks seen during the 2008 financial crisis. A modest rise in foreclosures is part of a normal, functioning market and not an immediate sign of systemic collapse.
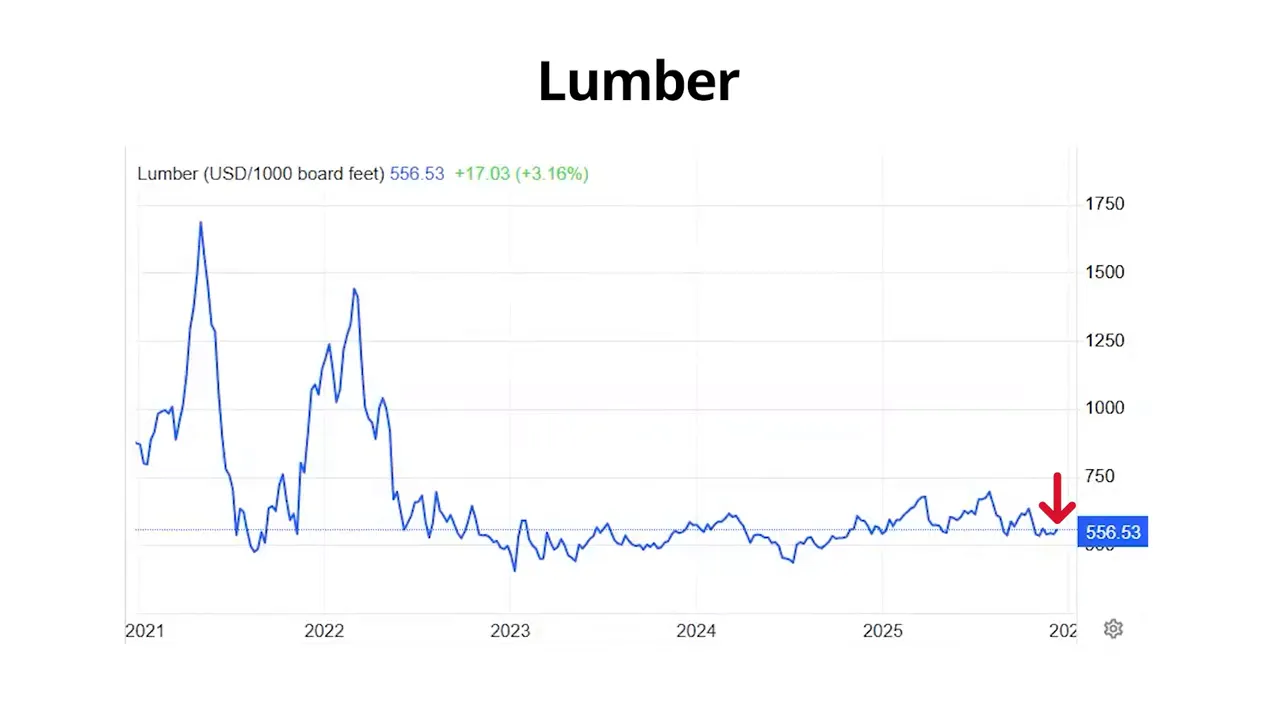
Lumber and material costs also influence building and remodeling. Recent data shows lumber prices have been relatively stable, with framing lumber near $556 per thousand board feet. Stable material pricing removes one variable that might otherwise push builder prices higher.
One data gap to acknowledge: some national labor and inflation releases have been delayed due to federal reporting disruptions. That complicates real-time comparisons, but local metrics like inventory, median price, and closed sales provide a reliable immediate signal for Omaha.
What this means for buyers and sellers
For buyers: the Omaha housing data suggests this is a market for disciplined buyers who are prepared. More inventory means more choices and a bit more negotiation power. If you are considering buying, focus on financing readiness, realistic search criteria, and a home that aligns with long-term financial plans.
For sellers: expect to compete. Homes still sell, but marketing must be paired with sensible pricing. When buyers have options, pricing and condition win the day. Significant price adjustments work better than marginal changes when trying to restart action on a listing.
For investors: the data indicates stabilizing prices and a healthy new construction pipeline. Long-term fundamentals like population growth, new data centers, and airport and corporate investment support demand in the Omaha metro.
Key takeaways from the latest Omaha housing data
- Inventory up modestly, moving toward pre-pandemic norms.
- New construction supply has increased thanks to national builders entering the market.
- Median prices are essentially flat year over year, showing stabilization.
- Mortgage spreads have improved, lowering the pressure on mortgage rates.
- Closed sales dipped seasonally, giving buyers a bit more negotiating power.
If you’re thinking about buying or selling in Omaha — or you have questions about how this data applies to your neighborhood or timeline — I’m happy to help. I provide free market advice, home valuations, and a clear strategy whether you’re listing or shopping for a home.
Call or text at 402-490-6771 or email davidmatney@nebraskarealty.com. You can also schedule a quick call here: Book a time.
Frequently asked questions about Omaha housing market
Are home prices in Omaha crashing?
No. Current Omaha housing data shows prices are stabilizing, with the median closed sales price up about 0.9 percent year over year. This is normal market adjustment after pandemic-era extremes, not a broad crash.
Is inventory increasing enough to create buyer advantage?
Inventory is up and buyers have more choices than during the pandemic. That gives buyers some negotiation power, but market dynamics vary by neighborhood and price point.
Why are new homes so expensive?
Approximately 25 percent of new construction costs are tied to land, regulation, permitting, inspections, and mandated upgrades. Those structural costs create a floor below which it is difficult to build.
Should I wait for interest rates to drop before buying?
Buying should be based on personal readiness and long-term plans. Rates could decline and bring more buyers off the sidelines. If you are ready financially and find the right property, the long-term benefits of homeownership can outweigh short-term rate movements.
What should sellers do if their home sits unsold?
Reassess price first. Pricing is the most effective lever to generate interest. If the home is competitively priced but still not moving, revisit condition and presentation next.
Are foreclosures a major risk right now?
Foreclosures have ticked up since the pandemic but are nowhere near the levels seen in the 2008 crisis. They are a normal part of market adjustment rather than evidence of widespread systemic failure.
Final perspective
The Omaha housing data tells a balanced story: a market that has cooled from the fever pitch of the pandemic, added supply through new construction, and is now settling into steady, more predictable behavior. Prices are stable, inventory gives buyers choices, and interest-rate dynamics will determine how quickly demand returns in the spring.
If you are trying to decide your next move, focus less on sensational headlines and more on the local data that impacts your neighborhood and price range. Thoughtful, long-term decisions built on accurate local Omaha housing data are the best path to success in this market.
Read More: Omaha’s 2026 Housing Market: What to Expect and How to Prepare